Archive for the 'reporting' Category

Pentaho 5.0 Reporting by Example: Beginner’s Guide

It’s been four years since I published Pentaho Reporting 3.5 for Java Developers.  A lot has changed in Pentaho Reporting since then, so it’s great to see a new book now available from Packt, Pentaho 5.0 Reporting by Example: Beginner’s Guide, co-authored by Mariano Mattio and Dario Bernabeu.  This book has a different purpose than the Java Developer book, it’s focus is a deeper dive into examples to quickly bring folks up to speed on the various capabilities of Pentaho Reporting.

For those who already are familiar with the basics of Pentaho Reporting, I would still recommend this book for a couple of reasons.  First, Chapter 12 covers both content linking and sparklines, very useful features for your every day reports.  Second, one of the newest features in Pentaho Reporting 5.0 is stylesheets.  In Chapter 13, this book does a great job at an initial introduction to get you started on this powerful capability.

Thanks Mariano and Dario for this great contribution!

5 Tips for Styling with Pentaho Report Designer

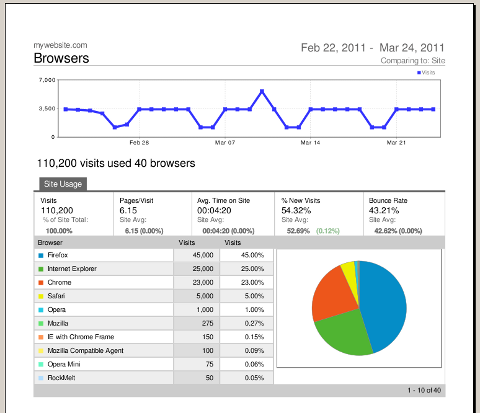
I’m a big fan of Google Analytics, I use it for all my personal websites to see what type of traffic I get.  One of my colleagues who is also impressed with their reports wanted to know if you could make a Pentaho Report look as good as Google’s output.  I quickly threw together the following report, to show that you can design just about anything in Pentaho Report Designer!

Check out the PDF and HTML rendering of the report.  Feel free to use the PRPT as a template for your own reports.

Here are my top 5 recommendations for folks when designing reports like this:

  1. Don’t be tempted to use the lines and rectangles.  Instead, use padding and borders of bands and elements.
  2. Inline Subreports allow you to pretty much layout anything, use them!
  3. The message-field report element is very powerful, you can specify number and date formats as part of the message: $(field, date, MMM yyyy).
  4. Make sure to test rendering in the output formats that you care about.  HTML renders as a set of tables, so you can’t have overlapping objects in your report.
  5. Take advantage of the “Paste Formatting” option, this allows you to copy colors, font sizes, etc, and will save you a lot of time.

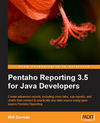
And of course don’t forget to get a copy of Pentaho Reporting 3.5 for Java Developers :-).  The book covers many topics, you can learn a lot about formula functions, chart options, shortcut keys, and much more.

JavaRanch Book Promotion

Want to try and win a free copy of Pentaho Reporting 3.5 for Java Developers?  Go visit JavaRanch.com and ask a question about the book in the Other Open Source Projects forum between now and the 16th of October, and you’ll be eligible to win one of the four books being given away.  I want to thank JavaRanch for promoting the book, they have over 100,000 Java Developers on their mailing list and a very active forum community.